
習得への3つのフェーズ
基盤構築:インターフェースの完全制御
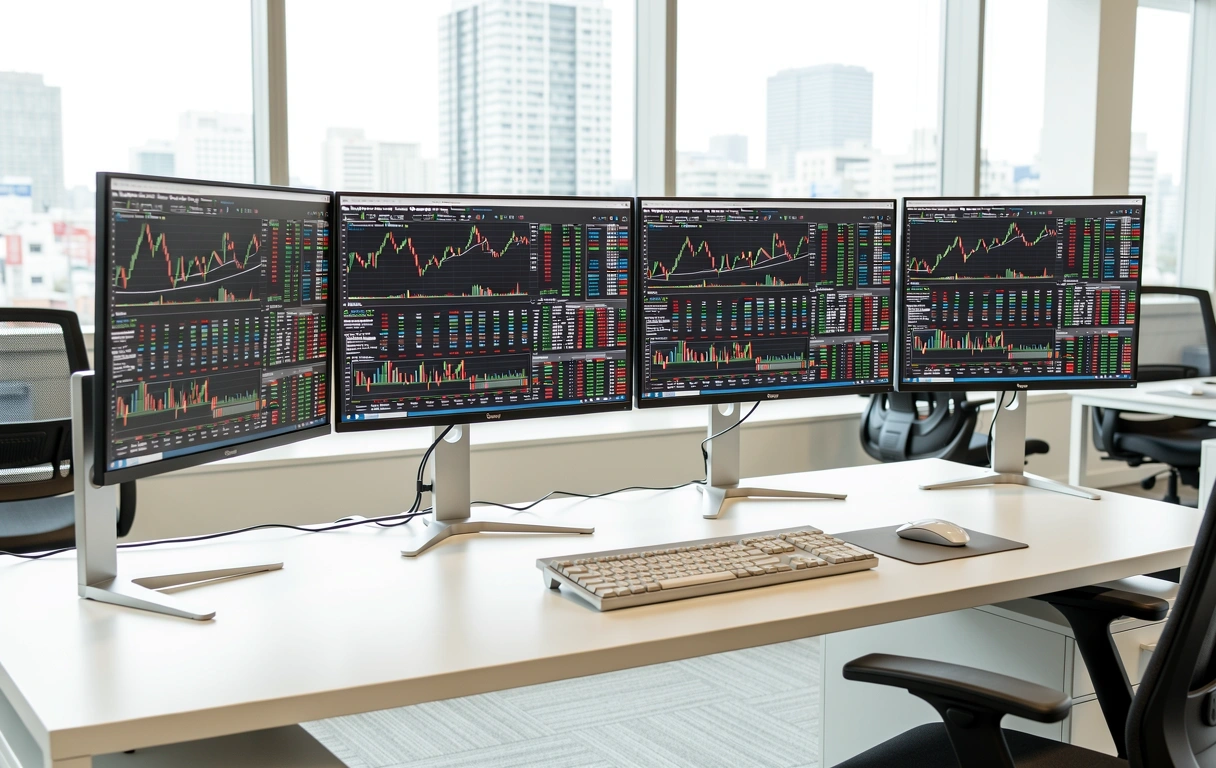
TradingViewの最大の強みはカスタマイズ性にあります。まずは描画ツールのショートカット、テンプレート保存、ウォッチリストの効率的な管理方法を学び、ストレスのない分析環境を構築します。
- 高速描画ワークフロー
- マルチタイムフレーム設定
- 独自ショートカット構築
読解技術:インジケーターの深層理解
数値の羅列を視覚的な根拠に変えるプロセスです。RSI、MACD、ボリンジャーバンドなどの標準機能から、Pine Scriptによるカスタムロジックの導入方法まで、多角的な分析視点を養います。
- 派生指標の組み合わせ
- 出来高プロファイル分析
- アラート機能の自動化
実践検証:バックテストと戦略構築
「リプレイ機能」を活用し、過去データを用いたシミュレーションを繰り返します。自分の分析が市場で通用するかを定量的に評価し、感情に左右されない意思決定プロセスを確立します。
- ストラテジーテスター活用
- リスク・リワード管理
- パフォーマンスレポート読解
詳細シラバス
Curriculum breakdown for 2026 academic year
チャートの哲学
ローソク足の本質的意味、ダウ理論の視覚化、そしてTradingViewにおける主要な描画ツールの物理的操作を徹底します。
高度なテクニカル実装
フィボナッチ・リトレースメントの独自設定、エリオット波動の描画規則、オシレーター系の同期分析手法を学びます。
市場相関とファンダメンタル
比較チャート機能を用いた通貨相関・金利相関の分析。経済カレンダーをチャート上に統合し、イベントドリブンな視点を獲得します。
卒業プロジェクト
独自のトレードルールをTradingView上でシステム化。バックテスト結果に基づいたリスク管理表の作成と、最終的なポートフォリオ・プランニング。
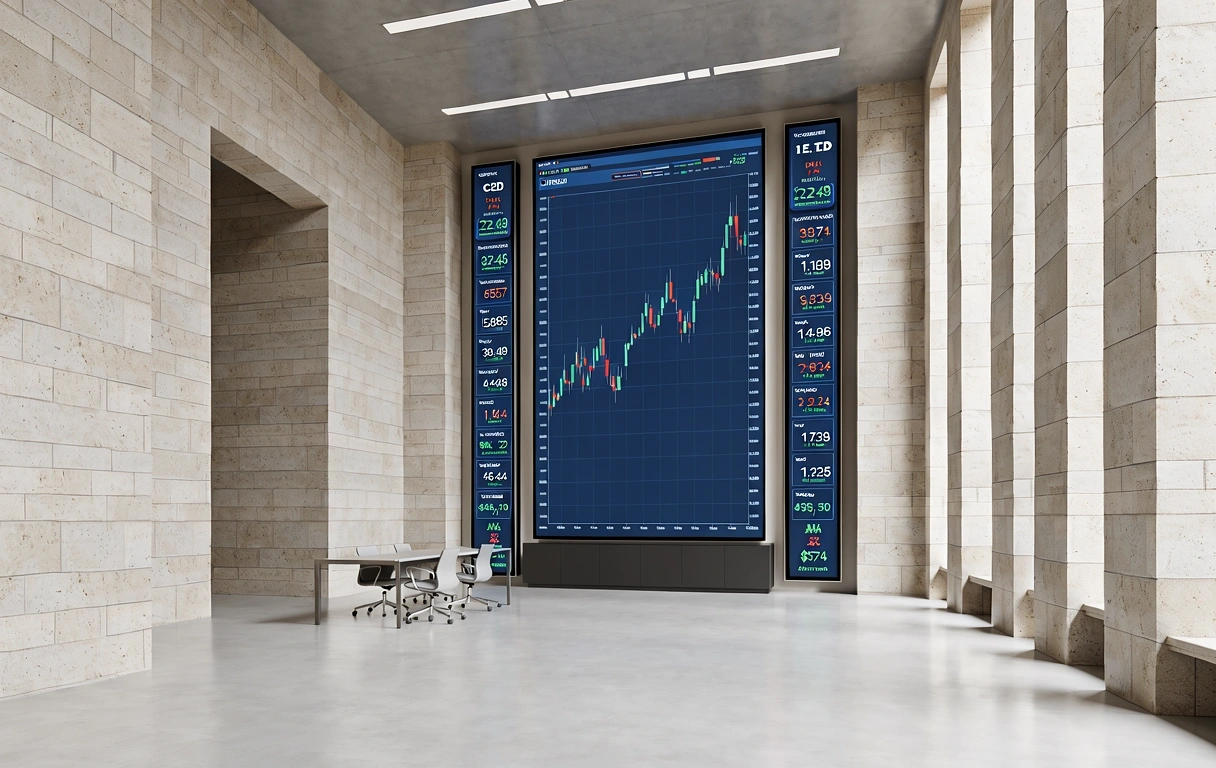
データに裏打ちされた
確信を、その手に。
当校の教育は「当てもの」としての相場予測を教えません。統計的な優位性を見つけ出し、それをTradingViewの強力な計算機能で検証するプロセスを重視しています。客観的な数値に基づいた自信こそが、長期的なキャリアを支える礎となります。
受講の準備と、継続的なサポート
プログラムの品質を維持するため、受講にあたっては以下の条件と環境を推奨しています。
推奨デバイス
快適なマルチチャート表示のため、13インチ以上のPCと安定した通信環境を推奨します。
学習時間の目安
週4〜6時間の自習時間を確保できる方を対象としています。復習用動画は24時間視聴可能です。
メンターシップ
独学では解決しにくいチャートの設定トラブルや解釈の疑問に対し、現役アナリストが直接回答します。
修了証の発行
全カリキュラムを修了し最終課題に合格された方には、Cannotsolvexa認定の修了証を発行します。